Inheriting and extending existing pivot/graph views in Odoo
Skilled
V12.0
V 12.0
Odoo has quite some pivot and graph reports by default available in Odoo. If you add custom development to existing models you usually want to have your custom values visible in the report(s) too though. We'll show you how to add fields to the existing sale report and some of the most used options in reports. In this tutorial you will learn how to inherit existing pivot/graph reports and how to add your own fields into the existing report.
Before you can inherit an existing report you will need to add the module to the dependency in your manifest file. Open up the manifest.py file in your custom module and inherit the sale module:
'depends': ['sale'],
In this tutorial we'll add a new field on the model 'sale.order' and on the 'sale.order.line' model, which links a sale order line to the order. Let us start with the 'sale.order' model:
Now that we have added the 'sale' module as a dependency we should add our own fields to the existing model from the sale orders. Create a new Python file named 'sale_order.py' in your custom module its 'models' folder. Inherit the existing model here and let's add a new field to the model:
# -*- coding: utf-8 -*-from odoo import models, fields, apiclass SaleOrder(models.Model): _inherit = 'sale.order' probability = fields.Float(string='Sale probability', default=60) The '_inherit' key will tell Odoo that we would like to inherit the model 'sale.order'. In this example we'll create a new field named 'probability' because we would like to estimate the change of a person or company buying something from us. We'll also want this value to be visible on the pivot and graph reports for analysis later on.
The next step is to also add a new field on the model 'sale.order.line'. Create a new Python file named 'sale_order_line.py' in your custom module its 'models' folder. Inherit the existing model here and let's add a new field to this model too:
# -*- coding: utf-8 -*-from odoo import models, fields, apiclass SaleOrderLine(models.Model): _inherit = 'sale.order.line' kickback_fee = fields.Float(string='Kickback fee') This will inherit the existing model 'sale.order.line' and will add a float (double) field to the existing model. In this example we assume that we have the option to get kickback fees from the supplier on some products, which we will add in this field and where we want to do sale analysis on too.
Now that we have the models ready we should add the fields to the order view so that we can fill them in and manage them too. Create a new XML file named 'sale_order_view.xml' in your custom module under the folder 'views' and don't forget to add it in your manifest.py file. Inherit the existing sale order view in your XML and add the fields to your form. The 'probability' field should be somewhere in the form while the 'kickback_fee' field has to be in the tree of the sale order lines.
So, what exactly does this code do? It inherits the default sale order view with an 'inherit_id' that links to the view in the module where it is originally created (sale.view_order_form). In the form view we do two xpath expressions. The first one will add our 'probability' field right after the customer his name. The second xpath will add the 'kickback_fee' in the sale order line tree that is visible on the form view, right after the price.
Great, you're almost done already! The final step is to inherit the report and add your own fields into it. How exactly do those reports in Odoo work though? A pivot and graph report by default have two major things: the views for showing the report and the model for computing the values in the report. As we're modifying an existing report we don't have to change anything to the view though! Odoo only needs the view definition and basic structure, if you add fields to a pivot or graph view you only need to modify the model.
The first thing to do is to inherit the model. Just like with any other model in Odoo we will need to add our custom fields here too. Create a new Python file named 'sale_report.py' in your custom module under the 'models' folder and inherit the 'sale.report' model, which is used for the report:
# -*- coding: utf-8 -*-from odoo import models, fields, apiclass SaleReport(models.Model): _inherit = 'sale.report' Now we have to add our two custom fields 'probability' and 'kickback_fee' but they should be readonly as pivot and graph reports are computed (and filled) from SQL queries by default. Just have a look at my example code:
# -*- coding: utf-8 -*-from odoo import models, fields, apiclass SaleReport(models.Model): _inherit = 'sale.report' probability = fields.Float(string='Probability', group_operator="avg", # The field is readonly as we'll set it in SQL. readonly=True) kickback_fee = fields.Float(string='Kickback fee', readonly=True) Notice anything different? Our field 'probability' has a special value, group_operator="avg", set. The 'group_operator' option is a built-in functionality from Odoo. If we do not set the option 'group_operator' on a field that is defined on the 'sale.order' model it will behave a bit odd. Odoo will automatically do 'probability' times the amount of sale order lines on a sale order. If you would set '50' in the field probability on your first sale order line and if you would have three sale order lines (in which you leave two lines their probability empty) you would see '150' in the pivot and graph report while you'd expect to see '50'. The 'group_operator' option will tell our reports that we just want this value to be used and shown once and that it is not related to our sale order lines.
Tip: Both fields are 'readonly' because they will be filled from the SQL.
Great! Let's just add two more fields to this model. Assume that you want to compute and show some values that are the result of some calculations and they're not directly available in the database. As we'll create the report with SQL queries it means we can create and fill our own values on the 'sale.report' model. Let us compute how much of a sale order is recurring profit (so subscription lines) and how much is a one time sale. Just add two fields for now:
monthly_profit = fields.Float(string='Monthly profit (recurring)', readonly=True) one_time_profit = fields.Float(string='One time profit (non-recurring)', readonly=True) Finally we just have one more thing to do: write the SQL queries! Because this report already exists it means we have to inherit the function that generates the SQL queries and add our own logic in the inherit. Odoo uses the function '_query' to write our SQL queries in so we should inherit it:
def _query(self, with_clause='', fields={}, groupby='', from_clause=''): You can inherit the existing function by just giving it the exact name and adding the same amount of parameters into the function definition. In this case the function has four parameters.
def _query(self, with_clause='', fields={}, groupby='', from_clause=''): # The "s." refers to the sale order model fields['probability'] = ", s.probability as probability" # The "l." refers to the sale order line model fields['kickback_fee'] = ", l.kickback_fee as kickback_fee" fields['monthly_profit'] = ", sum(l.price_subtotal) filter (where t.recurring_invoice = True) as monthly_profit" fields['one_time_profit'] = ", sum(l.price_subtotal) filter (where t.recurring_invoice = False) as one_time_profit" # If you select the measure 'Probability' it will automatically group by the probability too because of this. groupby += ', s.probability' # We need a groupby on the kickback_fee field as Odoo needs to group the sale order lines to be able # to compute and show all values correctly. groupby += ", l.kickback_fee" # Notice how we have no groupby for 'monthly_profit' or 'one_time_profit' as it is computed in SQL right away # and not stored on the model sale.order (we compute it from the sale order lines in plain SQL). return super(SaleReport, self)._query(with_clause, fields, groupby, from_clause) Still a little bit confused? Don't worry, I'll explain it with a bit more details. The value between fields[''] should contain the value of the field that you have defined on the 'sale.report' model. This will tell Odoo which field you want to fill. Everything after the '=' will be the SQL query. 's.' means we want to get values from the table 'sale.order' and 'probability' links to the field 'probability' on the 'sale.order' table. The 'as probability' will tell Odoo that we want to link it to the field 'probability' on the SQL level.
As you can see a few lines later in my code example you can also do whole SQL queries to compute values:
fields['monthly_profit'] = ", sum(l.price_subtotal) filter (where t.recurring_invoice = True) as monthly_profit" This will get the sum of all sale order lines their subtotal where the product does not have the option 'recurring_invoice' set to true (which is the boolean 'Subscription product'). The result of this query will be available in the field 'monthly_profit'.
Finally we have the 'groupby' option. The group by will tell Odoo that we want to group the results in the pivot or graph view by this value. It will automatically add the field as a row on the horizontal columns.
That's it! If you would now save all your files and install your module you would have these fields available on the report and as measures to filter on your report. Here is my result from this tutorial:
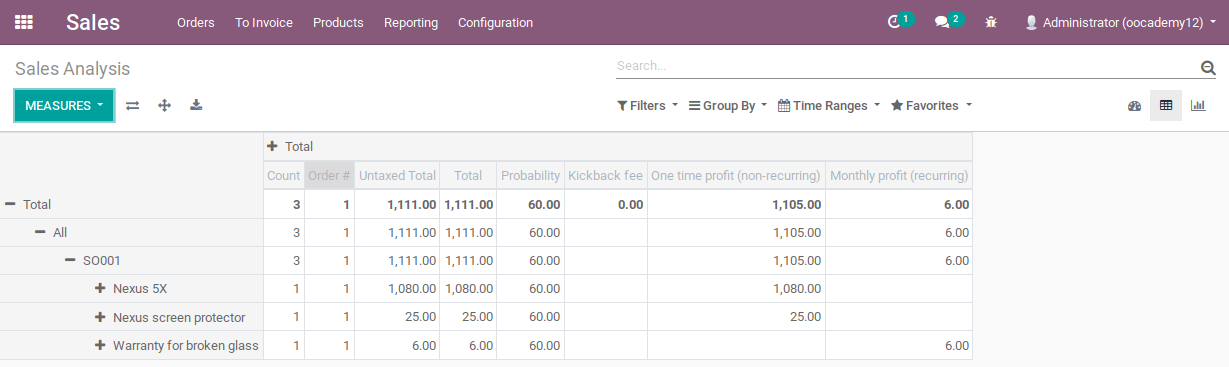
The SQL part of inheriting custom pivot/graph reports can be quite tricky and challenging. It will most likely take you some time to master and it is something where you need to take your time for. The possibilities and the flexibility of this part of Odoo are amazing though. You can modify and expand existing reports in less than a few hours to get all your needed data our. It is one of the skills you should master when you work with Odoo often so take your time for it.