Profiling code in Odoo
Skilled
V15.0
V 15.0
Since Odoo 11 a new tool was added to Odoo, named the profiler. This tool will allow you to see how code is behaving and how long every part of the code takes. This tool is especially handy if your code has to process big amounts of data or if you're facing performance issues in your code. In this tutorial you will learn how to use this profiler and how to identify issues in your code. We will inherit the 'res.partner' model and will create two Python functions. One function that has bad performance and one that has good performance. We'll look at the output and see how performance has been impacted by bad code.
Let us start with inheriting the 'res.partner' model and writing two Python functions. One function will get all contacts from the database and we'll check if there is any duplicate contact by looping over the records in Python. The second function will search through the contacts, in SQL, to find duplicate contacts. Create a new Python file named 'res_partner.py' in the 'models' folder of your custom module. In this file we will import the profiler and we'll inherit the 'res.partner' model:
# -*- coding: utf-8 -*-from odoo import models, fields, api# First import the tool so that you can use it!from odoo.tools.profiler import profileclass ResPartner(models.Model): _inherit = 'res.partner' As you can see the profiler is easily importable in Odoo as it is available under the tools. Now that we've inherited the model and have the profiler imported we should write our two functions.
Let's first write a Python function that has bad performance. Create a function named 'find_duplicate_contacts_bad_perf' in which you get all contacts through SQL. Then loop over the contacts in Python code to see if we already have a contact with the same name. If a match is found we'll modify the name to the existing name with '(duplicate)' behind it:
@profile @api.multi def find_duplicate_contacts_bad_perf(self): if self.name: # This part is totally bad code, ofcourse. You shouldn't just get all contacts out of the database and loop # over them in Python code as SQL is a lot faster. This will demonstrate the bad performance. contacts = self.env['res.partner'].search([('id', '!=', self.id)]) for contact in contacts: if contact.name == self.name: self.name = self.name + ' (duplicate)' So, did you notice anything? At the top of the function we have the '@profile' decorator set. This will tell Odoo that we want to profile this Python function (and only this function). This is the only thing that you need to profile a function to see how it performs! Obviously this code will be slow as SQL is a lot faster than doing these kind of checks in Python. We'll see that later on in the results.
Now let us create a second function that has good performance. Create a function named 'find_duplicate_contacts_good_perf' in which you find the duplicate records through SQL. If a match is found we'll modify the name to the existing name with '(duplicate)' behind it:
@profile @api.multi def find_duplicate_contacts_good_perf(self): if self.name: # This part is way better code than in the other function find_duplicate_contacts_bad_perf, ofcourse. # You should do your operations in the SQL side. This will demonstrate way better performance. related_contacts = self.env['res.partner'].search_count([('name', '=', self.name)]) if related_contacts > 1: self.name = self.name + ' (duplicate)' Just like our previous function this one has the profiler decorator too. This way Odoo knows that we want to get insights in this function too.
Now let's create two buttons on the contact form to trigger these functions. Create a new XML file named 'res_partner_view.xml' in your 'views' folder and inherit the view:
That's all you need! To see the results you should open your logfile to view the output. Open your logfile in a terminal so that you can see the content being printed:
tail -f /var/log/odoo/your_odoo_logfile.log Install or update your module and go to the form view. You will see your two buttons there. First click on the 'Profile bad function' button and then on the 'Profile good function' button. Now look at your terminal where you have the logfile opened. You will see similar output as this: 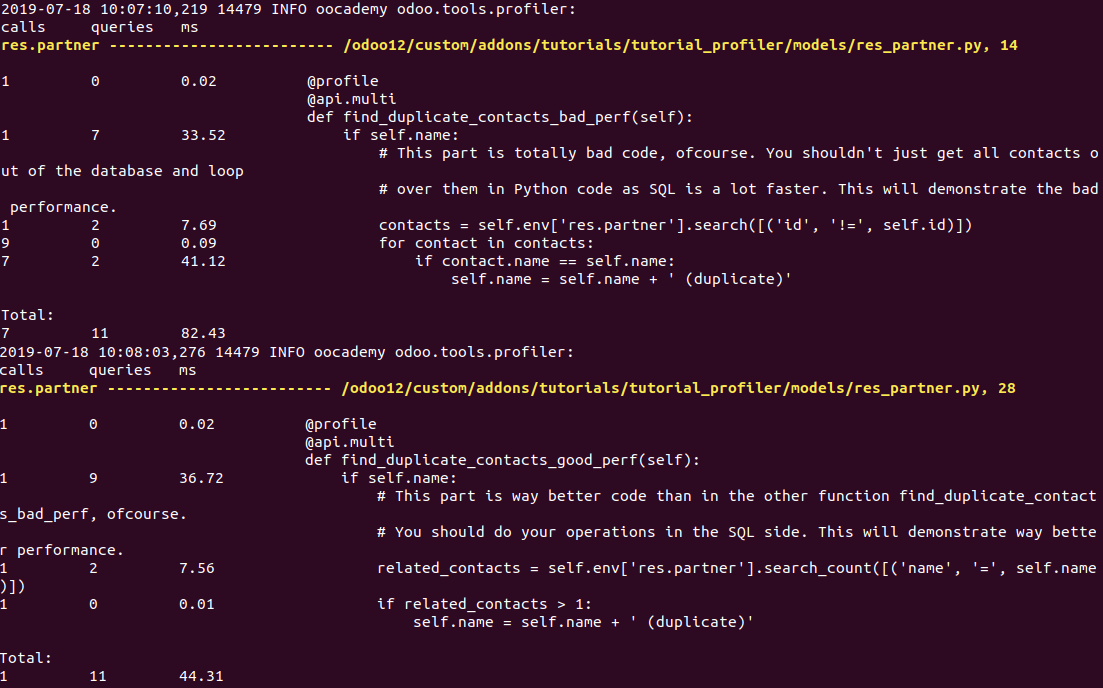
So, what does this tell you? Every line in the Python function that you've profiled is being timed. First you can see how many calls the line of code did, followed by the amount of queries and the milliseconds this line took. The 'ms' part is the most important insight usually. If one line really jumps out in time there is usually an issue with performance (unless you're getting thousands of records from the database ofcourse). At the end of the function you will see a line 'Total:' which shows the total amount of calls, queries and duration for the whole function. As you can see in the above output our bad function took 82.43 milliseconds while our good function 'just' took 44.31.
When you look at the output of the bad function you can see that most of the time was spent in the for loop, 41.12ms. This tells you that this part of your code is taking a lot of time and that is when the question comes in: how can I improve this? For this example it is easy, you should do SQL operations instead of Python operations. As a rule of thumb usually bad performance is caused by one of these:
Sadly there is no quick answer to performance issues. The profiler should help you a lot though. With the profiler you know where in the function(s) you have performance issues. Usually if you take some time to look at the code and think about how to improve it you'll solve your performance issues in no time though!
The profiler is a very handy tool to get insight into the performance of your function(s). If you're stuck developing as your code is too slow you should add a profiler and look closely at the results. Take the time to look at the results and then the code to figure out what is going on. If you do this every once in a while you'll see that you get better at writing code that performs well resulting in happier end users.